
MY ROLE
TEAM
TIMEFRAME
TOOLS USED (2)
AFFECTED LANGUAGES
PROJECT OVERVIEW
Main Challenge
Creating a budget forecasting MVP feature: The client needed to allow users to simulate the impact of different ad budget allocations on their target metrics in a risk-free way.
What's Nexoya?
Solution
I translated a CEO-driven vision into a usable product: While the empathise, definition stage was shaped by the CEO's deep expertise in performance marketing users, I was responsible for turning into a functional user experience ready for delivery.
See AI-Simulations design in action!
Impact
MVP feature creation: Budget simulations
SaaS USP: User ability to forecast budget changes
Overwhelmingly positive client feedback:
Client feedback
APPROACH
Context: Turning expert knowledge into an intuitive design was key to building a scalable product. Like many fast-moving scale-ups, leadership insight drove innovation—shaping the empathise, define, and research stages through C-level expertise.
Design Thinking: Because it balances empathy, creativity, and speed—perfect for rapid, user-validated MVPs in scale-ups.
Empathise
Understand the user.
What are the goals, needs, wants and frustrations?
Define
Define the problem. What needs to be solved, and how do we do it?
Research
Generative user research: Interviews and other contact: What do we need to do?
1.Ideate
Lay out user flows: Create the base.
Create first designs to visualise said flows.
2.Refine
Refine the designs from the ideate phase and cut out the noise.
3.Prototype
and Test
Create a solid prototype to test with real users.
Does this solution add value for the user?
4.Refine as
needed
Incorporate user feedback into the design solution.
5.Deliver
Final check: Rollout and hand-over design solution to the development team.
IDEATE
Create the base
The foundation of every MVP comes from a user journey that acts as a base. The "Happy flow", which shows the core structure of the simulation flow, is shown below.

How did we decide on this Happy flow?
From the previous research phase of this project, we were able to identify the following as core stages and corresponding user needs.
Setup
User need:
Ability to set up different simulations quickly.
Solution:
Feature set up with a familiar UI feel. Most suitable approach: Integration of prominent "Simulation" category into 2nd level architecture.
Exploration
User need:
Easily review the impact of budgets on metrics.
Solution:
Intuitive simulation exploration mode. Emphasis on transparency and clarity, and scenario comparison.
Most suitable elements: Charts and tables.
Application
User need:
"I want to apply this budget to my portfolio."
Solution:
Option for the user to apply a budget from a simulation scenario to their portfolio to achieve their target metric.
Most suitable element: Primary button.
Flow -> First designs
With the user flow defined, we began visualizing the simulation feature through focused A/B testing and UX experimentation.
FIRST MID-FIDELITY ITERATIONS

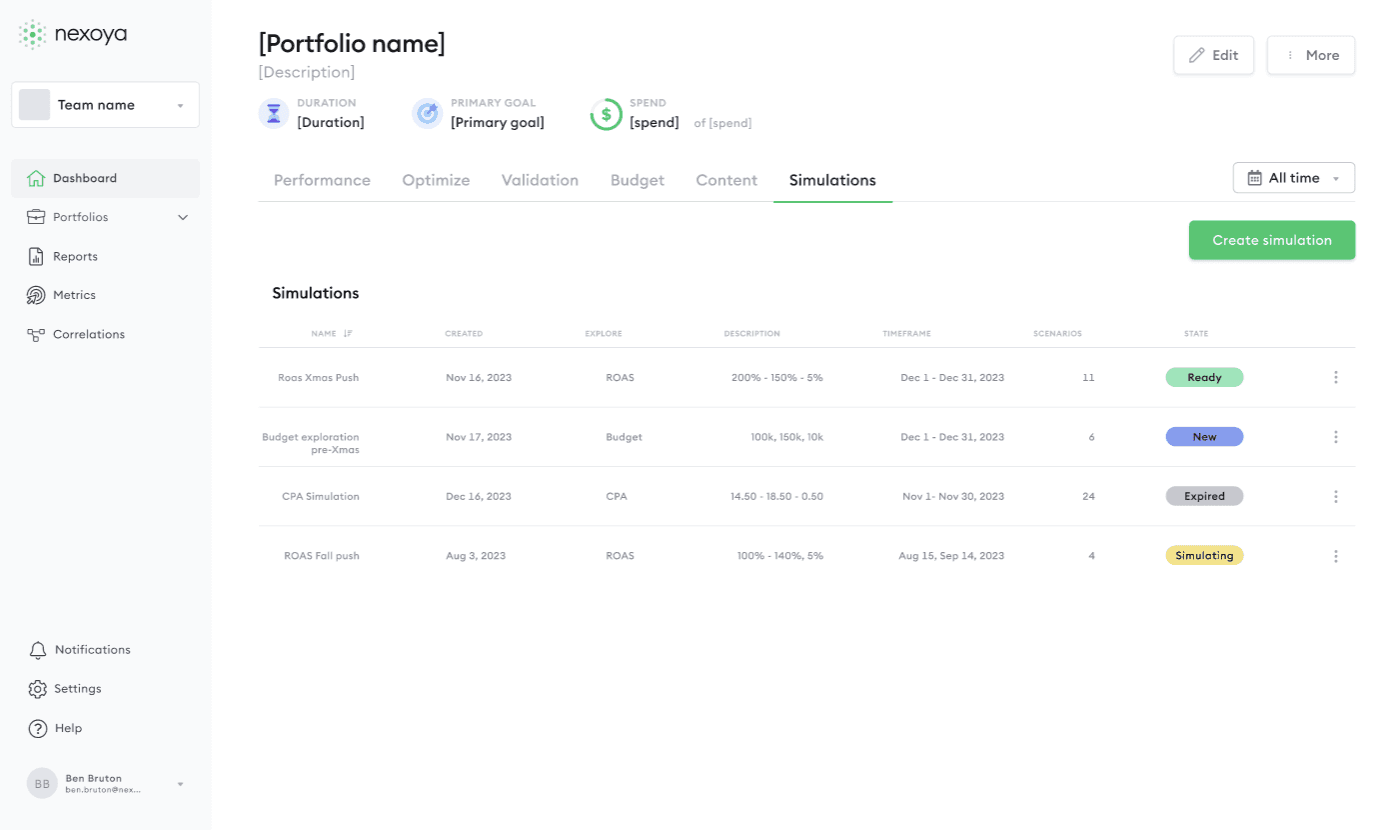




Approved/Rejected designs
Several design ideas were explored: some didn’t make the cut. Slide to see befores and afters.

Why the table?
Replacing in-page selection with an overview table clarifies context and aids informed decisions.


Why a modal?
A pre-launch modal emphasizes review, preserves context, and ensures users confirm before proceeding.
"But aren't multiple iterations a waste of time?"
REFINE
Key themes
We refined the MVP simulations feature with key stakeholders, focusing on three core user steps: simulation setup and user exploration.
Simulation Setup
To keep things simple and scalable, we focussed on simplicity, and user learnability.
1.1 Simplicity
ISSUE:
Multiple simulation exploration types: Too much for an MVP.
SOLUTION:
Replace 2 individual simulation exploration types (Budgets, ROAS) with just Budgets simulation.


Why only 1 scenario type?
1.2 Learnability
ISSUE:
Need to help guide the user: Provide additional information to explain concepts.
SOLUTIONS:
Add question mark icon, tools and explainer for "Budget steps between scenarios".
Add tooltip in datepicker.
Why the need for explainers? Will users actually read them?
Exploration
With the user flow defined, we began visualizing the simulation feature through focused A/B testing and UX experimentation.
2.1 Discoverability through Hierarchy


PROTOTYPE AND TEST
Who were the testers?
The testers fell into two main groups:
1. Our internal CSMs who have daily direct contact with our clients
2. The clients themselves.
How was the prototype received?
On the whole, we were glad to see our work was received well!
To summarise the findings:
Positives
Data was easy to interpret.
Slider widget was easy to use.
"Huh" moments
How accurate are the simulated results? And can they be trusted?
REFINE AS NEEDED
Incorporating Testing Feedback: Transparency.
Solutions: Visualised
TABLE

TABLE TOOLTIP

CHART TOOLTIP

DELIVER
Final checks
Before handing over to dev, a final check was in order. This includes checking for final copy, consistencies and double-checking with wider members of the team before handoff.
Developed solution: It's live!
Results
Users were overwhelmingly impressed with the scenario simulations feature. Reviews include:
Project impact
The project was an MVP, acting as a base for future iterations and improvements, depending on changing business needs and future user feedback.
By investing time and strategic decision making to this project, we were able to increase sales, reduce churn and add real value to the daily tasks of performance marketers. It also highlights the value of creating a powerful UI: A frame to allow AI to do its work.
Project takeaways
My personal takeaway: One thing that stuck with me is the value of a strong "Definition" phase of the design process together with key stakeholders.
By bringing in expertise from different areas of the company, including intricate customer knowledge and being aware of technical limitations, we could create something to ship relatively quickly. Therefore, foundations are key in saving time down the line.
